Symbols on electricity meters and types of meters
When electricity was first used for commercial purposes in the 1880s, calculating electricity bills was relatively simple. It was enough to count the number of lamps installed in a building or motors in an industrial hall. However, as the number of electronic devices with varying electricity demands increased, more precise measurement of energy consumption became necessary, shifting the focus from individual devices to household or company-wide networks.
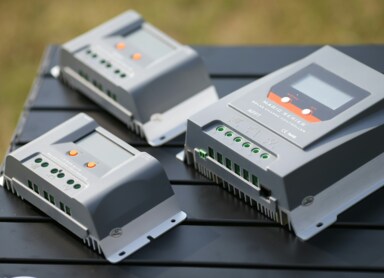
Today, at points of electricity consumption, you may encounter one of three types of meters:
-
Induction meter – usually single-tariff (G11); changing the electricity tariff often requires replacing the meter.
-
Digital meter – allows remote reading of electricity consumption and generates pulses directly proportional to the energy drawn from the grid.
-
Smart meter – enables two-way communication between the provider and the consumer, exchanging data at regular intervals, minimizing measurement errors, and quickly detecting outages.
Modern meters with LCD screens display symbols that provide specific information relevant to electricity bills.
Symbols on electricity meters – a word about the OBIS standard
Most modern electricity meters show real-time consumption data. This goes beyond basic information like the number of kilowatt-hours used. To standardize readings, the OBIS (Object Identification System) is implemented, regulated by the international IEC 62056-6-1 standard.
Regardless of whether you are reading a meter in Poland, Spain, or Germany, the rules for interpreting OBIS codes are the same. Each OBIS code corresponds to a specific value. Users can scroll through screens using “forward” and “back” buttons on the meter. OBIS codes also cycle automatically, so you only need to wait briefly.
Depending on the tariff type, the OBIS code set may vary slightly, which is why meters usually include a reference guide. Changing the tariff is not the same as changing the electricity provider; switching providers usually grants access to the same or similar tariffs, sometimes at a different rate.
How to read symbols on classic single-flow meters
For typical single-flow meters, OBIS code labeling depends on the tariff:
-
Tariffs G11 and C11 – minimal information: total active energy (15.8.1) and active tariff name (0.2.2).
-
Tariffs G12, G12as, C12b – includes active energy during the day (15.8.1), night (15.8.2), active tariff name (0.2.2), and date/time (0.9.2 and 0.9.1).
-
Tariffs G12w and C12a – distinguishes peak energy (15.8.1), off-peak energy (15.8.2), plus date, time, and tariff name.
-
Tariffs G13 and C13 – three-zone meters measure morning peak (15.8.1), afternoon peak (15.8.2), and off-peak hours (15.8.3), including date, time, and tariff label.
OBIS codes often repeat across tariffs, so it’s important to know which tariff you are using. For single-flow meters, a simplified set of OBIS codes is sufficient.
Interpreting meter readings
The most important reading for a consumer is the total electricity consumption. Knowing the rate per kilowatt-hour (or rates for multi-tariff meters) allows you to estimate your electricity bill. Multiply the consumed energy by the applicable rate, keeping in mind that bills also include fixed and variable charges.
Symbols on bi-directional meters
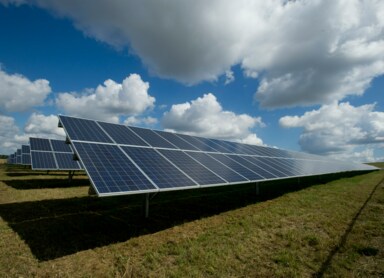
Single-flow meters are simple to read, but matters become more complex with photovoltaic installations. Regular consumers only draw electricity as needed. Prosumers with solar panels can also produce electricity. Excess energy must be sent back to the grid, which needs to be recorded.
Bi-directional meters measure both energy drawn from and supplied to the grid. OBIS codes are expanded to record these flows:
- Active energy drawn – total, peak, off-peak, other hours (1.8.0, 1.8.1, 1.8.2, 1.8.3).
- Active energy supplied – total, peak, off-peak, other hours (2.8.0, 2.8.1, 2.8.2, 2.8.3).
- Inductive reactive energy – by time zone (5.8.0, 5.8.1, 5.8.2, 5.8.3).
- Capacitive reactive energy – by time zone (6.8.0, 6.8.1, 6.8.2, 6.8.3).
Navigating the interface of a bi-directional meter may take some practice, especially for users accustomed to single-flow meters.
Some providers also offer online platforms (e.g., Tauron Dystrybucja’s e-licznik) that allow monitoring daily, monthly, and yearly energy usage, calculating averages, and comparing periods, which is useful for companies with multiple branches or individual users who rent properties.